

Views: 0 Author: Site Editor Publish Time: 2026-07-31 Origin: Site


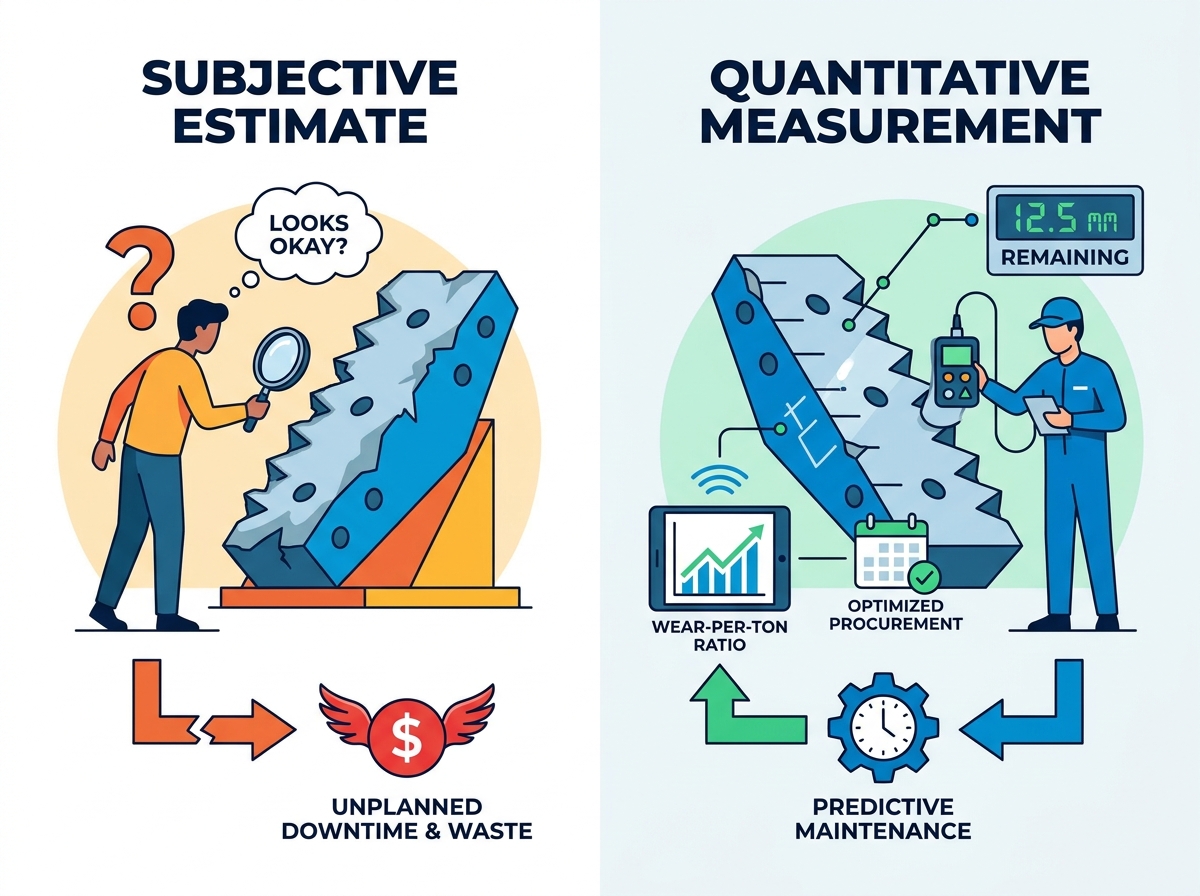
Relying on visual estimates for crusher maintenance leads to either catastrophic equipment failure or wasted budget on premature replacements. Operators often guess when a component might fail based solely on surface appearance. This subjective approach exposes operations to severe risks and unnecessary expenses. A proactive inspection requires verifiable data instead of intuition. Moving from qualitative observation to quantitative measurement allows maintenance teams to optimize production safely. It helps managers plan procurement without risking unplanned downtime. You maximize component utility while keeping personnel safe.
To make informed, data-backed replacement decisions, operators must track specific dimensional and performance metrics during every scheduled maintenance window. You will discover exactly which physical measurements guarantee equipment reliability. We will also explore how to correlate these dimensions with operational symptoms. Finally, you will learn the exact standards needed to inspect specific crushing components effectively.
Track Dimensional Loss: Use ultrasonic thickness gauges and profile templates to measure exact material loss, not just surface appearance.
Monitor Operational Symptoms: Correlate physical measurements with dropping throughput, poor product gradation, and increased power draw.
Standardize Jaw Inspections: Pay specialized attention to the nip angle, corrugation depth, and toe wear on jaw crusher plates and side liners.
Align with Procurement: Use localized wear rates to forecast replacement timelines, factoring in lead times to avoid emergency freight costs.
Subjective visual checks fail to identify uneven wear patterns. Human eyes cannot detect underlying structural fatigue reliably. Many operators simply look at a liner and guess its remaining lifespan. This practice risks severe damage to the crusher frame. When liners thin out unevenly, stress transfers directly to the parent machine. Frame repairs cost exponentially more than scheduled liner replacements. Visual inspections also ignore localized gouging. A part might look fine overall but contain weak points ready to fracture. Relying on intuition eventually guarantees a mid-shift breakdown.
A successful inspection protocol yields a precise "wear-per-ton" ratio. You calculate this metric by comparing physical material loss against the tonnage processed. This data enables highly accurate lifecycle forecasting. You can predict the exact week a component will require replacing. It also optimizes inventory management. Managers stop ordering parts too early or too late. The operation relies on hard data instead of operator guesswork. You transform maintenance from a reactive panic into a controlled, scheduled process.
Consider the stark difference between scheduled downtime and emergency failures. Scheduled maintenance happens during planned outages. You lose no active production hours. Conversely, a mid-shift failure stops the entire plant immediately. You lose thousands of dollars in revenue every hour. Operators also waste capital by replacing parts too early. Pulling a liner containing twenty percent of its usable life wastes money directly. Data-driven inspections prevent both scenarios. You extract maximum value from every component while avoiding catastrophic revenue losses.
You must measure the lowest points of the wear profile accurately. Use ultrasonic thickness gauges or heavy-duty calipers for this task. These tools determine the remaining structural integrity of the base metal. Take readings across multiple zones to find the thinnest sections. Record these measurements in a standardized log. Comparing current thickness against original specifications reveals the true wear rate. Do not measure only the peaks. The valleys dictate the actual structural limit of the component.
Track the curvature of the crushing chamber over time. Material flow alters the cavity geometry constantly. A cupped or distorted profile severely impacts the nip angle. It drastically reduces crushing efficiency. You can use custom profile templates to check the cavity shape. Place the template against the liner surface during inspections. Gaps between the template and the liner reveal exactly where material attrition happens fastest. Maintaining optimal cavity shape ensures consistent throughput.
Identify high-stress zones inside the chamber immediately. Measure the depth of any localized gouges carefully. Deep gouges indicate highly abrasive feed material or improper feeding practices. You must evaluate these specific weak points. They often dictate the failure timeline of the entire part. Data on localized wear helps you make better future purchasing decisions. It tells you whether different alloy compositions are necessary. You might require thicker liner profiles for the next replacement cycle.
Inspect the backing material thoroughly. Check all seating surfaces behind the liners. Gaps or movement here indicate compromised fitment. Poor fitment accelerates wear rapidly. It causes the part to flex and strike the crusher frame during operation. Measure any deformation on the parent metal. Ensure you apply fresh backing compound correctly during installation. Solid mating surfaces transfer crushing forces safely into the machine frame. Loose parts shatter prematurely.
Clean the measuring surface thoroughly using a wire brush before taking readings.
Apply adequate couplant gel when using ultrasonic thickness gauges.
Take three distinct readings at every checkpoint and record the average.
Mark measurement zones using industrial paint pens for future consistency.
Compare current readings directly against the previous week's logged data.
Measure the height difference between the peaks and valleys of the jaw plates. Deep corrugations provide the necessary leverage to shatter rock efficiently. Flattened corrugations drastically reduce this gripping force. When teeth wear down, the crusher struggles to grab incoming material. This condition increases slabby product output. It also forces the rock to grind against the plates instead of fracturing cleanly. You must track this depth degradation weekly. Schedule a replacement before the plate loses its ability to grip the feed.
Measure thickness at the extreme ends of both stationary and movable jaws. The lower third, known as the toe, typically experiences the highest attrition. Rock density increases at the bottom of the chamber. The crushing forces reach their maximum limit here. This high-stress zone almost always dictates the replacement schedule. You must monitor toe thickness diligently to prevent base plate exposure. Alternatively, upper heel wear indicates poor feed distribution. Recording both areas gives you a complete picture of chamber dynamics.
You must check Jaw Crusher Plates and Side Liners for uneven lateral wear constantly. Side liners protect the main frame cheeks from abrasive rocks. Worn side liners can allow material to bypass the crushing chamber entirely. Small rocks slip behind the main plates. This rogue material damages the mainframe cheek plates severely. Measure the thickness of side liners along the central crushing zone. Replace them immediately if you detect severe gouging or channeling along the edges.
Calculate the current nip angle during every shutdown. The nip angle determines how well the jaws grab incoming rocks. As jaw plates wear down, this crucial angle increases naturally. An excessive angle causes material to boil or slip upward. The rock bounces around rather than crushing downward. This boiling effect destroys throughput and wastes immense energy. Use a digital protractor to verify the angle between the fixed and moving jaws. Keep the angle within the manufacturer's specified tolerance.
Measure how frequently operators must adjust the CSS to maintain product size. The CSS determines the final output dimensions of your aggregate. As liners wear down, the CSS gap naturally widens. Rapid adjustments indicate accelerated wear part degradation. If you must adjust the setting daily, the liners are failing rapidly. Track these adjustment logs meticulously. Correlate the frequency of CSS changes directly to your physical thickness measurements. This correlation confirms your wear-per-ton calculations.
Track the baseline amperage draw of the crusher motor. Worn parts require significantly more energy to crush the same volume of rock. This happens due to the loss of optimal chamber geometry. A flattened wear profile loses mechanical advantage. The motor works harder to force rocks through a compromised cavity. Monitor the power meter constantly during shifts. Spikes in energy usage often precede physical component failure. High power draw combined with low throughput confirms extreme liner wear.
Analyze the output aggregate regularly. Take samples from the discharge belt for sieve analysis. An increase in oversized material points directly to a compromised wear profile. Similarly, excessive fines indicate that rock is grinding rather than breaking. Both scenarios ruin product quality. Use gradation data as an early warning system. When output sizes shift away from the target range, schedule an immediate physical inspection of the crushing chamber.
Operational Symptom | Likely Physical Cause | Required Inspection Action |
|---|---|---|
Increased Amperage Draw | Flattened corrugations or cupped profile | Measure tooth height and chamber curvature |
Frequent CSS Adjustments | Rapid toe wear on movable jaw | Measure remaining thickness at the lower third |
Material Boiling / Slipping | Excessive nip angle due to base metal wear | Calculate nip angle using a digital protractor |
Oversized Flaky Product | Loss of gripping force in the cavity | Check corrugation depth across all plates |
Establish fixed measurement points on all components. Use grid patterns or specific casting marks as reference nodes. This ensures consistency across different inspectors and shifts. If one technician measures the top edge and another measures the center, the data becomes useless. Create a visual map of the liners. Distribute this map to all maintenance personnel. Standardized points guarantee that you compare identical zones over time. Accurate historical data relies entirely on this physical consistency.
Ensure digital tools operate accurately before entering the machine. Ultrasonic gauges require specific calibration for different metals. You must calibrate them for the specific manganese or high-chrome alloys being inspected. Sound waves travel differently through standard steel than through work-hardened manganese. 3D scanners also require clean lenses and updated software. Test all measurement equipment on a known reference block daily. Uncalibrated tools produce false readings. False readings lead to catastrophic operational decisions.
Enforce strict Lockout/Tagout procedures without exception. Never allow personnel near the crushing chamber before isolating all power sources. Implement rigorous confined space protocols. The crushing cavity presents extreme hazards from falling rocks and moving heavy steel. Clear all bridging material above the jaws safely before inspection begins. Wear appropriate personal protective equipment always. No measurement metric is worth compromising human safety. Document all safety compliance steps before signing the inspection permit.
Failing to clean mud and packed dust off the measurement zones.
Guessing the original thickness instead of referencing the OEM manual.
Ignoring the side liners while focusing solely on the main crushing plates.
Taking measurements without clearing the feed hopper completely.
Divide the measured millimeter loss by the tonnage processed safely. This formula predicts the exact date the part will reach its minimum safe thickness. For example, if a plate loses two millimeters per ten thousand tons, you establish a firm baseline. Track the daily plant production accurately. Multiply the expected daily tonnage by the established wear rate. You now possess a mathematical timeline for part failure. This calculation removes all emotion and guesswork from maintenance scheduling.
Cross-reference the projected failure date with current supply chain lead times. Trigger procurement when remaining life matches expected delivery time plus a fifteen percent safety buffer. Global supply chains fluctuate constantly. Waiting until the part reaches ten percent life courts disaster. If delivery takes four weeks, you must order when you have six weeks of usable metal left. This strategy eliminates emergency freight costs completely. It guarantees continuous operation without stressful logistical scrambles.
Use your inspection metrics to evaluate future component strategies. If data shows rapid, uneven wear constantly, investigate alternative options. Standard parts might not suit your specific rock abrasiveness. Use the dimensional data to evaluate whether to transition to custom-profiled aftermarket Crusher Wear Parts. Heavy-duty profiles or modified alloys might double your lifespan. The numbers tell the true story. Let the physical data justify the investment in higher-tier metallurgical upgrades.
Effective inspections require measuring thickness precisely, profiling cavity geometry accurately, and correlating physical wear with production metrics. You cannot optimize a modern crushing plant using visual guesswork. By standardizing your measurement protocols, you protect your equipment frame from catastrophic stress. You also protect your operational budget from premature replacement costs.
Action-oriented next steps:
Implement a standardized measurement log for your next maintenance shutdown immediately.
Purchase reliable ultrasonic thickness gauges and train your crew on calibration.
Use the collected data to audit your current wear part suppliers for performance and longevity.
Calculate your exact wear-per-ton ratio to optimize your next procurement cycle.
A: Initial baseline measurements should be taken weekly on new parts to establish a wear rate, transitioning to bi-weekly or monthly based on the calculated wear-per-ton lifecycle.
A: While dependent on the specific crusher model and alloy, plates are typically replaced when wear reaches 60–70% of the original tooth height, or when the base plate nears structural minimums outlined by the manufacturer.
A: Yes. 3D laser scanning provides a highly accurate, holistic view of the wear profile and cavity geometry, eliminating human error in manual caliper or gauge readings.
A: Uneven wear can alter the optimal nip angle and cavity shape, forcing the motor to work harder to crush material that is slipping or improperly gripped, even if the parts retain overall thickness.
